Color in Data Visualization
Per default color is used to convey information and lead the eyes of the audience. In other words, if individual data points are worth highlighting use color to do so.
Mix as little color as possible. For example if several categories are worth paying attention to within a pillar, make use of the shades of the semantic color to create contrast between those. Use shades of the same color instead of adding more hues of color.
If you want to learn which colors should be used visit the Data Visualization Color page for more information about when to use which color and color scales.
The Most Important Color
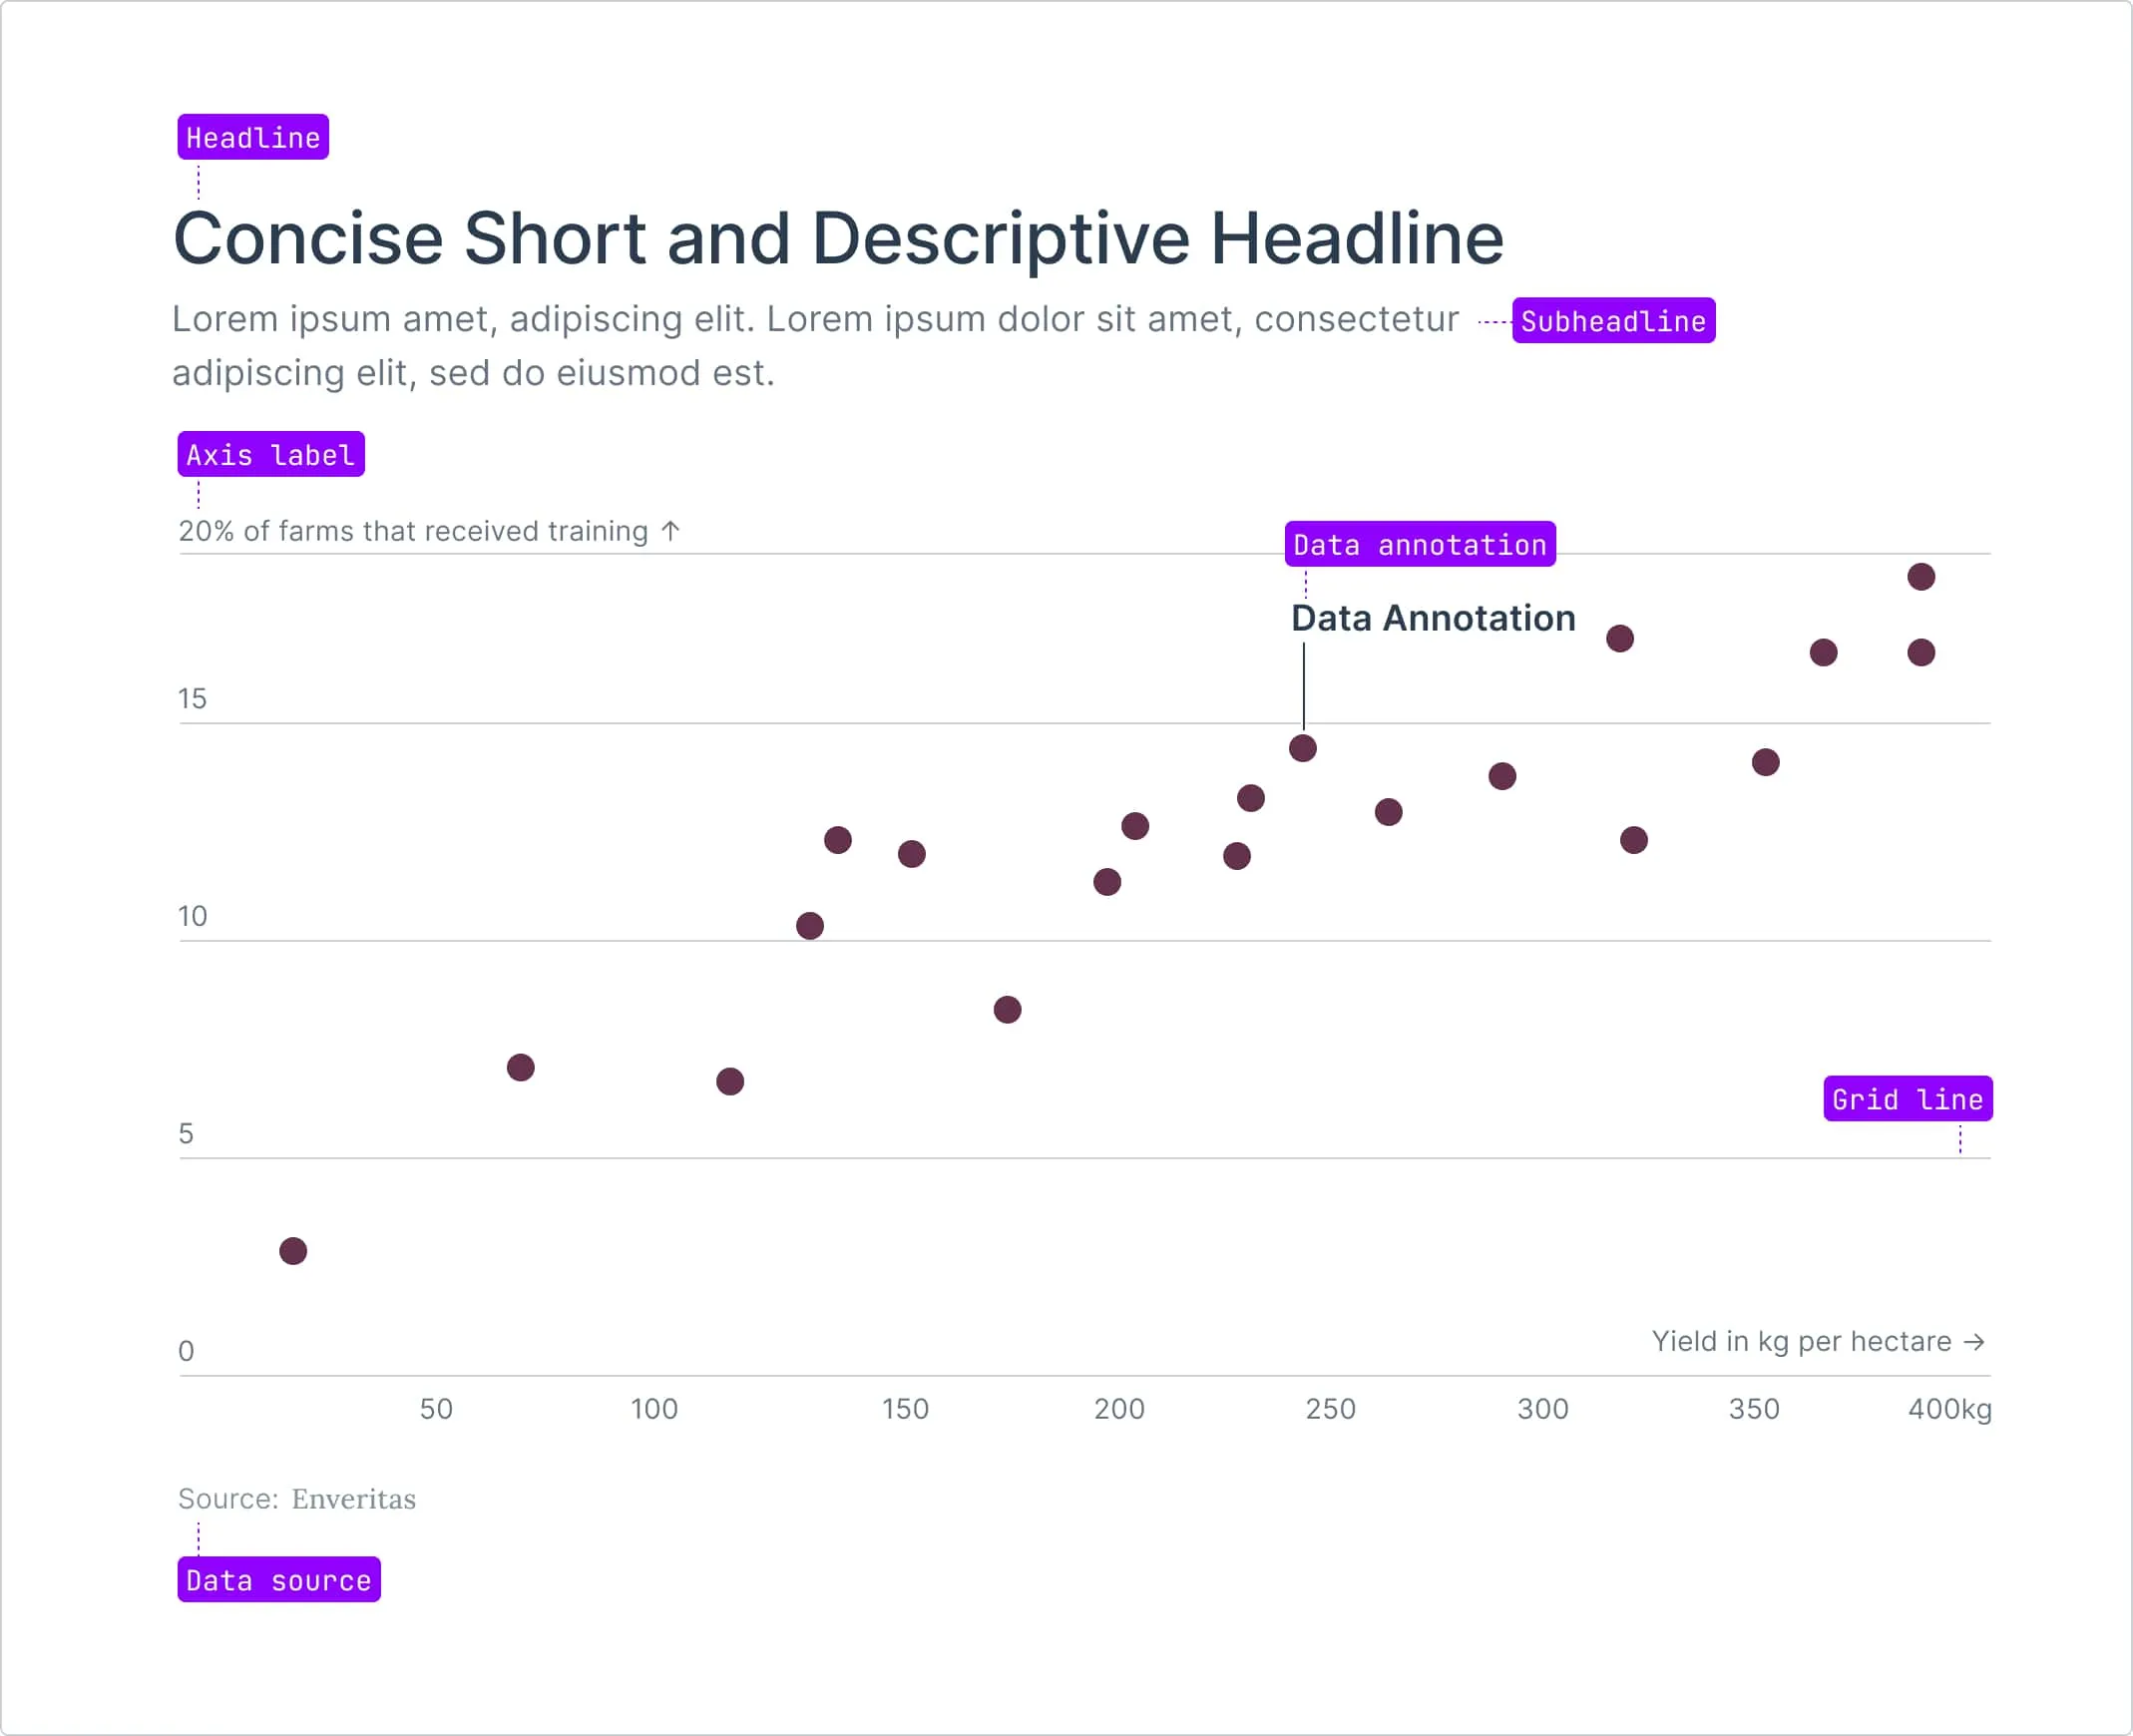
A lot of gray is ok. Each visualization uses different tones of gray for non-data elements because not all elments are equally important for the user to scan at first glance.
Here you find an example of a chart that displays the different elements in a composition.
| Sample | Design Token | Output Value | Usage |
|---|---|---|---|
fg.default | #2a3c4f | Headline | |
fg.muted | #485768 | Subheadline, Legend keys, Axis labels | |
fg.subtle | #87929e | Chart Footer | |
gray.300 | #cbd1d7 | Grid Lines |
Semantic Colors
The use of color should be intentional and enhance the data narrative. To improve readability, recurring topics are consistently mapped with the same colors and scales where appropriate.
Default color
When designing static reports, it’s essential to prioritize clarity by using a minimal amount of color. To highlight important data points, the primary highlight color should be navy 700, while less significant data should be displayed using gray 300 for reduced visual prominence. When multiple categories need to be differentiated, use varying shades of navy, following an indexed order in the table below to maintain consistency and visual harmony across generated reports.
| Sample | Design Token | Output Value | Usage |
|---|---|---|---|
navy.800 | #274376 | Default color; highlight individual data | |
navy.700 | #3d5c93 | Default second category color | |
navy.600 | #5876ab | Default third category color | |
navy.500 | #7891bd | Default fourth category color | |
navy.400 | #9aacca | Default fifth category color | |
navy.300 | #bdc7d8 | Default sixth category color | |
navy.200 | #dfe3e9 | Default seventh category color |
For static assets, the navy 700 is the default for highlighting key information. If more than one category is represented, use the same indexed order of navy shades from the table below to map the data consistently. If data is highlighted the remaining datapoints are colored in a gray 300, maintaining the overall rule of using fewer colors where possible.
| Sample | Design Token | Output Value | Usage |
|---|---|---|---|
gray.300 | #cbd1d7 | Default non-highlighted data | |
gray.800 | #2a3c4f | Alternative non-highlighted data |
Pillar Scores
Color scale used to render scores between 0 and 100.
| Sample | Design Token | Output Value | Score |
|---|---|---|---|
| – | #D3803A | 0 to 10 share | |
| – | #D7904B | 20% share | |
| – | #DBA05C | 30% share | |
| – | #DDAF6C | 40% share | |
| – | #DFBF7D | 50% share | |
| – | #E1CB91 | 60% share | |
| – | #E4D2A8 | 70% share | |
| – | #E5D9BE | 80% share | |
| – | #E5E0D4 | 90% share | |
| – | #E5E8EB | > 95% share |
Tracebility
Traceability of prchase volume is visualized through a shade of purple.
| Sample | Design Token | Output Value | Category |
|---|---|---|---|
purple.700 | #7f4a66 | Volume |
Impact
| Sample | Design Token | Output Value | Category |
|---|---|---|---|
cyan.600 | #528b8d | Farmers supported |
Survey Response
| Sample | Design Token | Output Value | Response |
|---|---|---|---|
cyan.700 | #417274 | Highly agrees | |
cyan.500 | #66a4a7 | Agrees | |
gray.300 | #cbd1d7 | Neutral | |
purple.500 | #ae8197 | Disagrees | |
purple.700 | #7f4a66 | Highly disagrees |
Scales
Use the primary color scale by default for most cases. If needed, use the secondary and then the tertiary scale for differentiation. This ensures clarity, with the primary scale being the most frequently used.
Sequential
Use a sequential color scale when representing data that progresses from low to high, such as temperature or population density.
Diverging
Use a diverging color scale when displaying data with a meaningful midpoint, like deviations from an average, to highlight values above and below a central point.
Color Shades
Enveritas data reports touches recurring concepts. To facilitate understanding the data color choices
Purple
| Sample | Design Token | Output Value |
|---|---|---|
purple.100 | #f6f2f4 | |
purple.200 | #e7e1e3 | |
purple.300 | #d3c1c9 | |
purple.400 | #c0a1b0 | |
purple.500 | #ae8197 | |
purple.600 | #98647f | |
purple.700 | #7f4a66 | |
purple.800 | #64324d |
Orange
| Sample | Design Token | Output Value |
|---|---|---|
orange.100 | #f9f1ea | |
orange.200 | #f0dfd3 | |
orange.300 | #e9c0a1 | |
orange.400 | #e39e6a | |
orange.500 | #d3803a | |
orange.600 | #b9681e | |
orange.700 | #985515 | |
orange.800 | #79420e |
Cyan
| Sample | Design Token | Output Value |
|---|---|---|
cyan.100 | #e8f4f5 | |
cyan.200 | #d4e7e8 | |
cyan.300 | #a9d2d4 | |
cyan.400 | #84bcbe | |
cyan.500 | #66a4a7 | |
cyan.600 | #528b8d | |
cyan.700 | #417274 | |
cyan.800 | #315a5c |
Navy
| Sample | Design Token | Output Value |
|---|---|---|
navy.100 | #f1f4f7 | |
navy.200 | #dfe3e9 | |
navy.300 | #bdc7d8 | |
navy.400 | #9aacca | |
navy.500 | #7891bd | |
navy.600 | #5876ab | |
navy.700 | #3d5c93 | |
navy.800 | #274376 |
Red
| Sample | Design Token | Output Value |
|---|---|---|
red.100 | #faf3f2 | |
red.200 | #efdedc | |
red.300 | #e6beba | |
red.400 | #e19b95 | |
red.500 | #db766f | |
red.600 | #ce504c | |
red.700 | #b43333 | |
red.800 | #902626 |
Yellow
| Sample | Design Token | Output Value |
|---|---|---|
yellow.100 | #f6f0e0 | |
yellow.200 | #ebe2ca | |
yellow.300 | #e0c786 | |
yellow.400 | #cbac5a | |
yellow.500 | #b19447 | |
yellow.600 | #967d38 | |
yellow.700 | #7b662c | |
yellow.800 | #615020 |