Datawrapper
Datawrapper is the default tool for creating consistent charts at Enveritas and should be used for all cases involving static charts for reports and presentations. It ensures that all generated assets adhere to Enveritas’ branding—covering typography, colors, and language—making it easier for the audience to recognize the information as coming from Enveritas.
Prerequisites
If you’re in a situation where you’re regulary create static charts for reporting you’re eligible to have your own datawrapper account and can request an account in the #ask-it slack channel.
Using Datawrapper
Creating a chart in Datawrapper follows four consecutive steps:
-
Data upload
Upload your dataset as a
.csvor paste its content in the textarea input. -
Check & describe
Prepare the uploaded dataset to work with the intended chart type.
-
Visualize
Pick a chart type and customise. For example: edit axis, colors or add add annotations.
-
Publish & embed
Prepare your chart asset for the export.
Folder Structure
Datawrapper provides a nested folder structure to organise chart assets. This is the central place where all generated charts are grouped by report type, year and country. Created charts can and should be duplicated of the same chart type is used again with a new set of data.
We’re aiming to maintain a flat folder structure to minimize clicks when locating assets. To avoid extra nesting, include the date (either YYYY or YYYY-MM-DD if it’s recurring multiple times a year) in the report folder names. The top-level folder structure will be organized by four main use cases: assets for either a slide deck or report, which can be specific to a client or serve as general assets used across all clients or internally.
Please follow the folder structure and naming of assets similar to the examples below:
General folder structure
- Audience_asset_type e.g.: Client_reports, General_slides - Report_title - YYYY-MM-DD_Country Optional parameters: MM-DD - Category Optional if necessary
- Datawrapper_chart
Example client report folder structure
- Client_reports - Client - Report_title - YYYY-MM-DD_Country Report instance
- Category Optional if necessary - Datawrapper_chart
All generated charts can also be found via the keyword search.

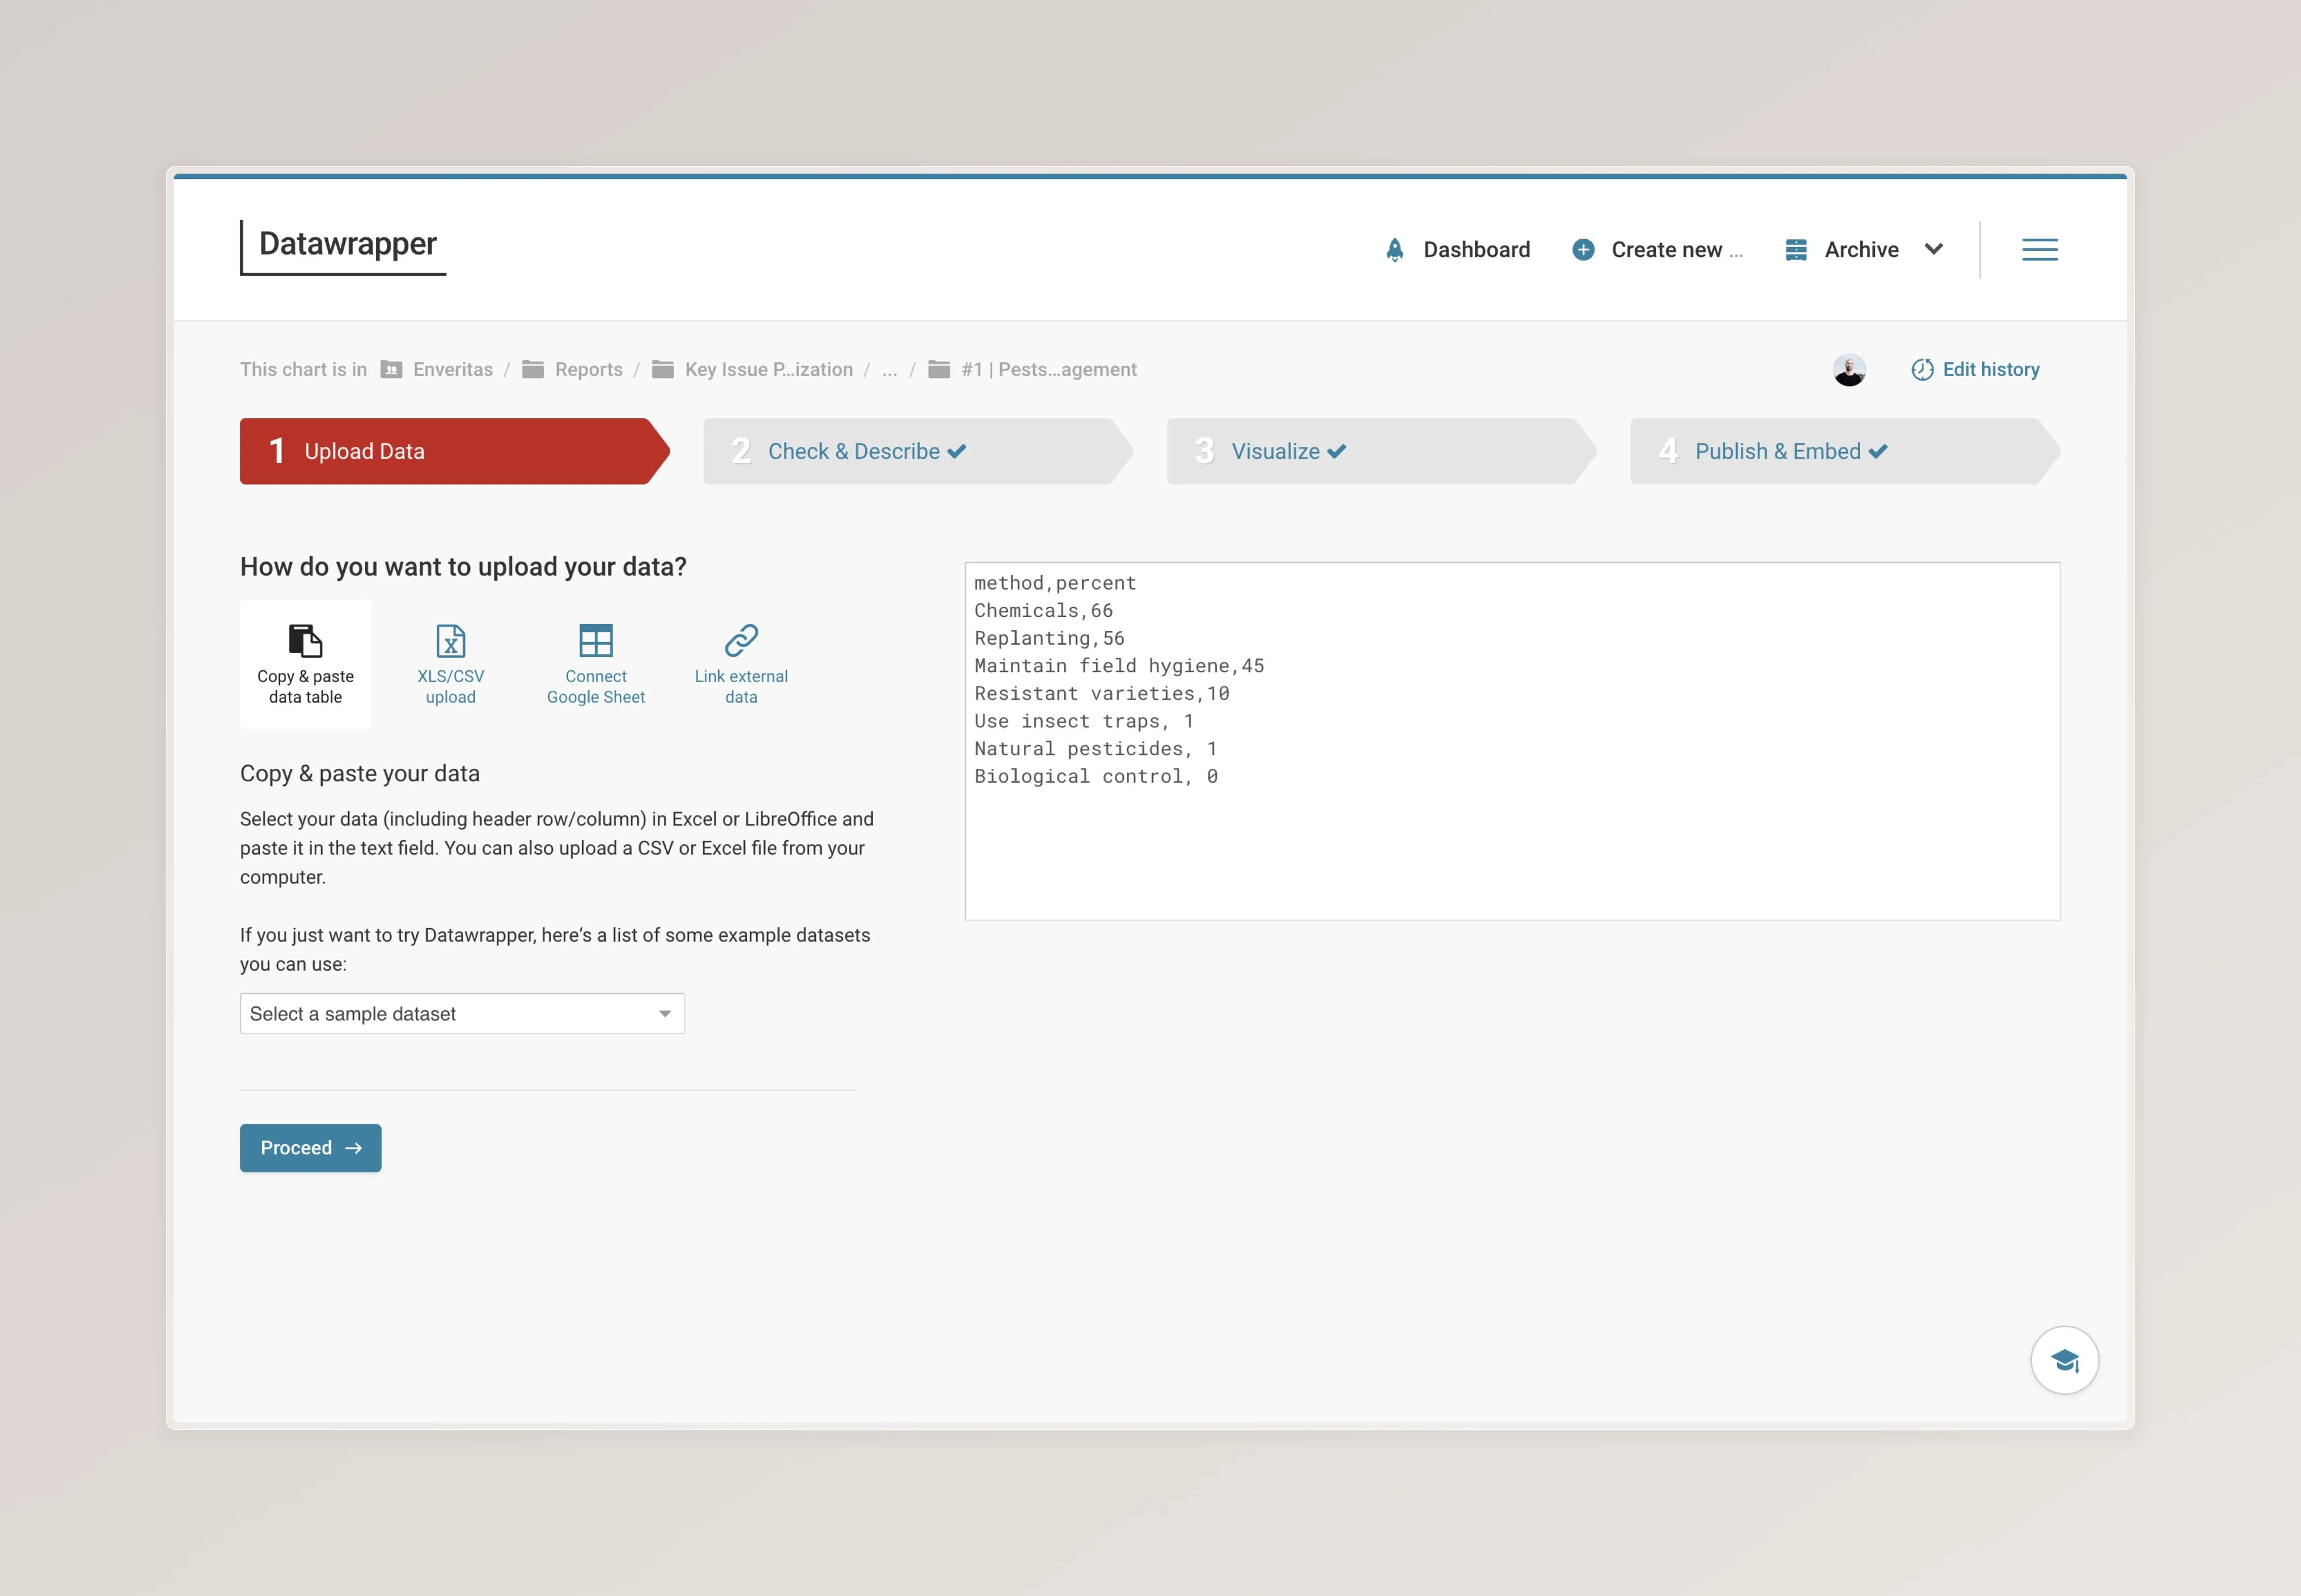
Data Upload
A new chart starts with uploading a dataset to Datawrapper. Either upload your dataset as a CSV or paste the content into the text area field.
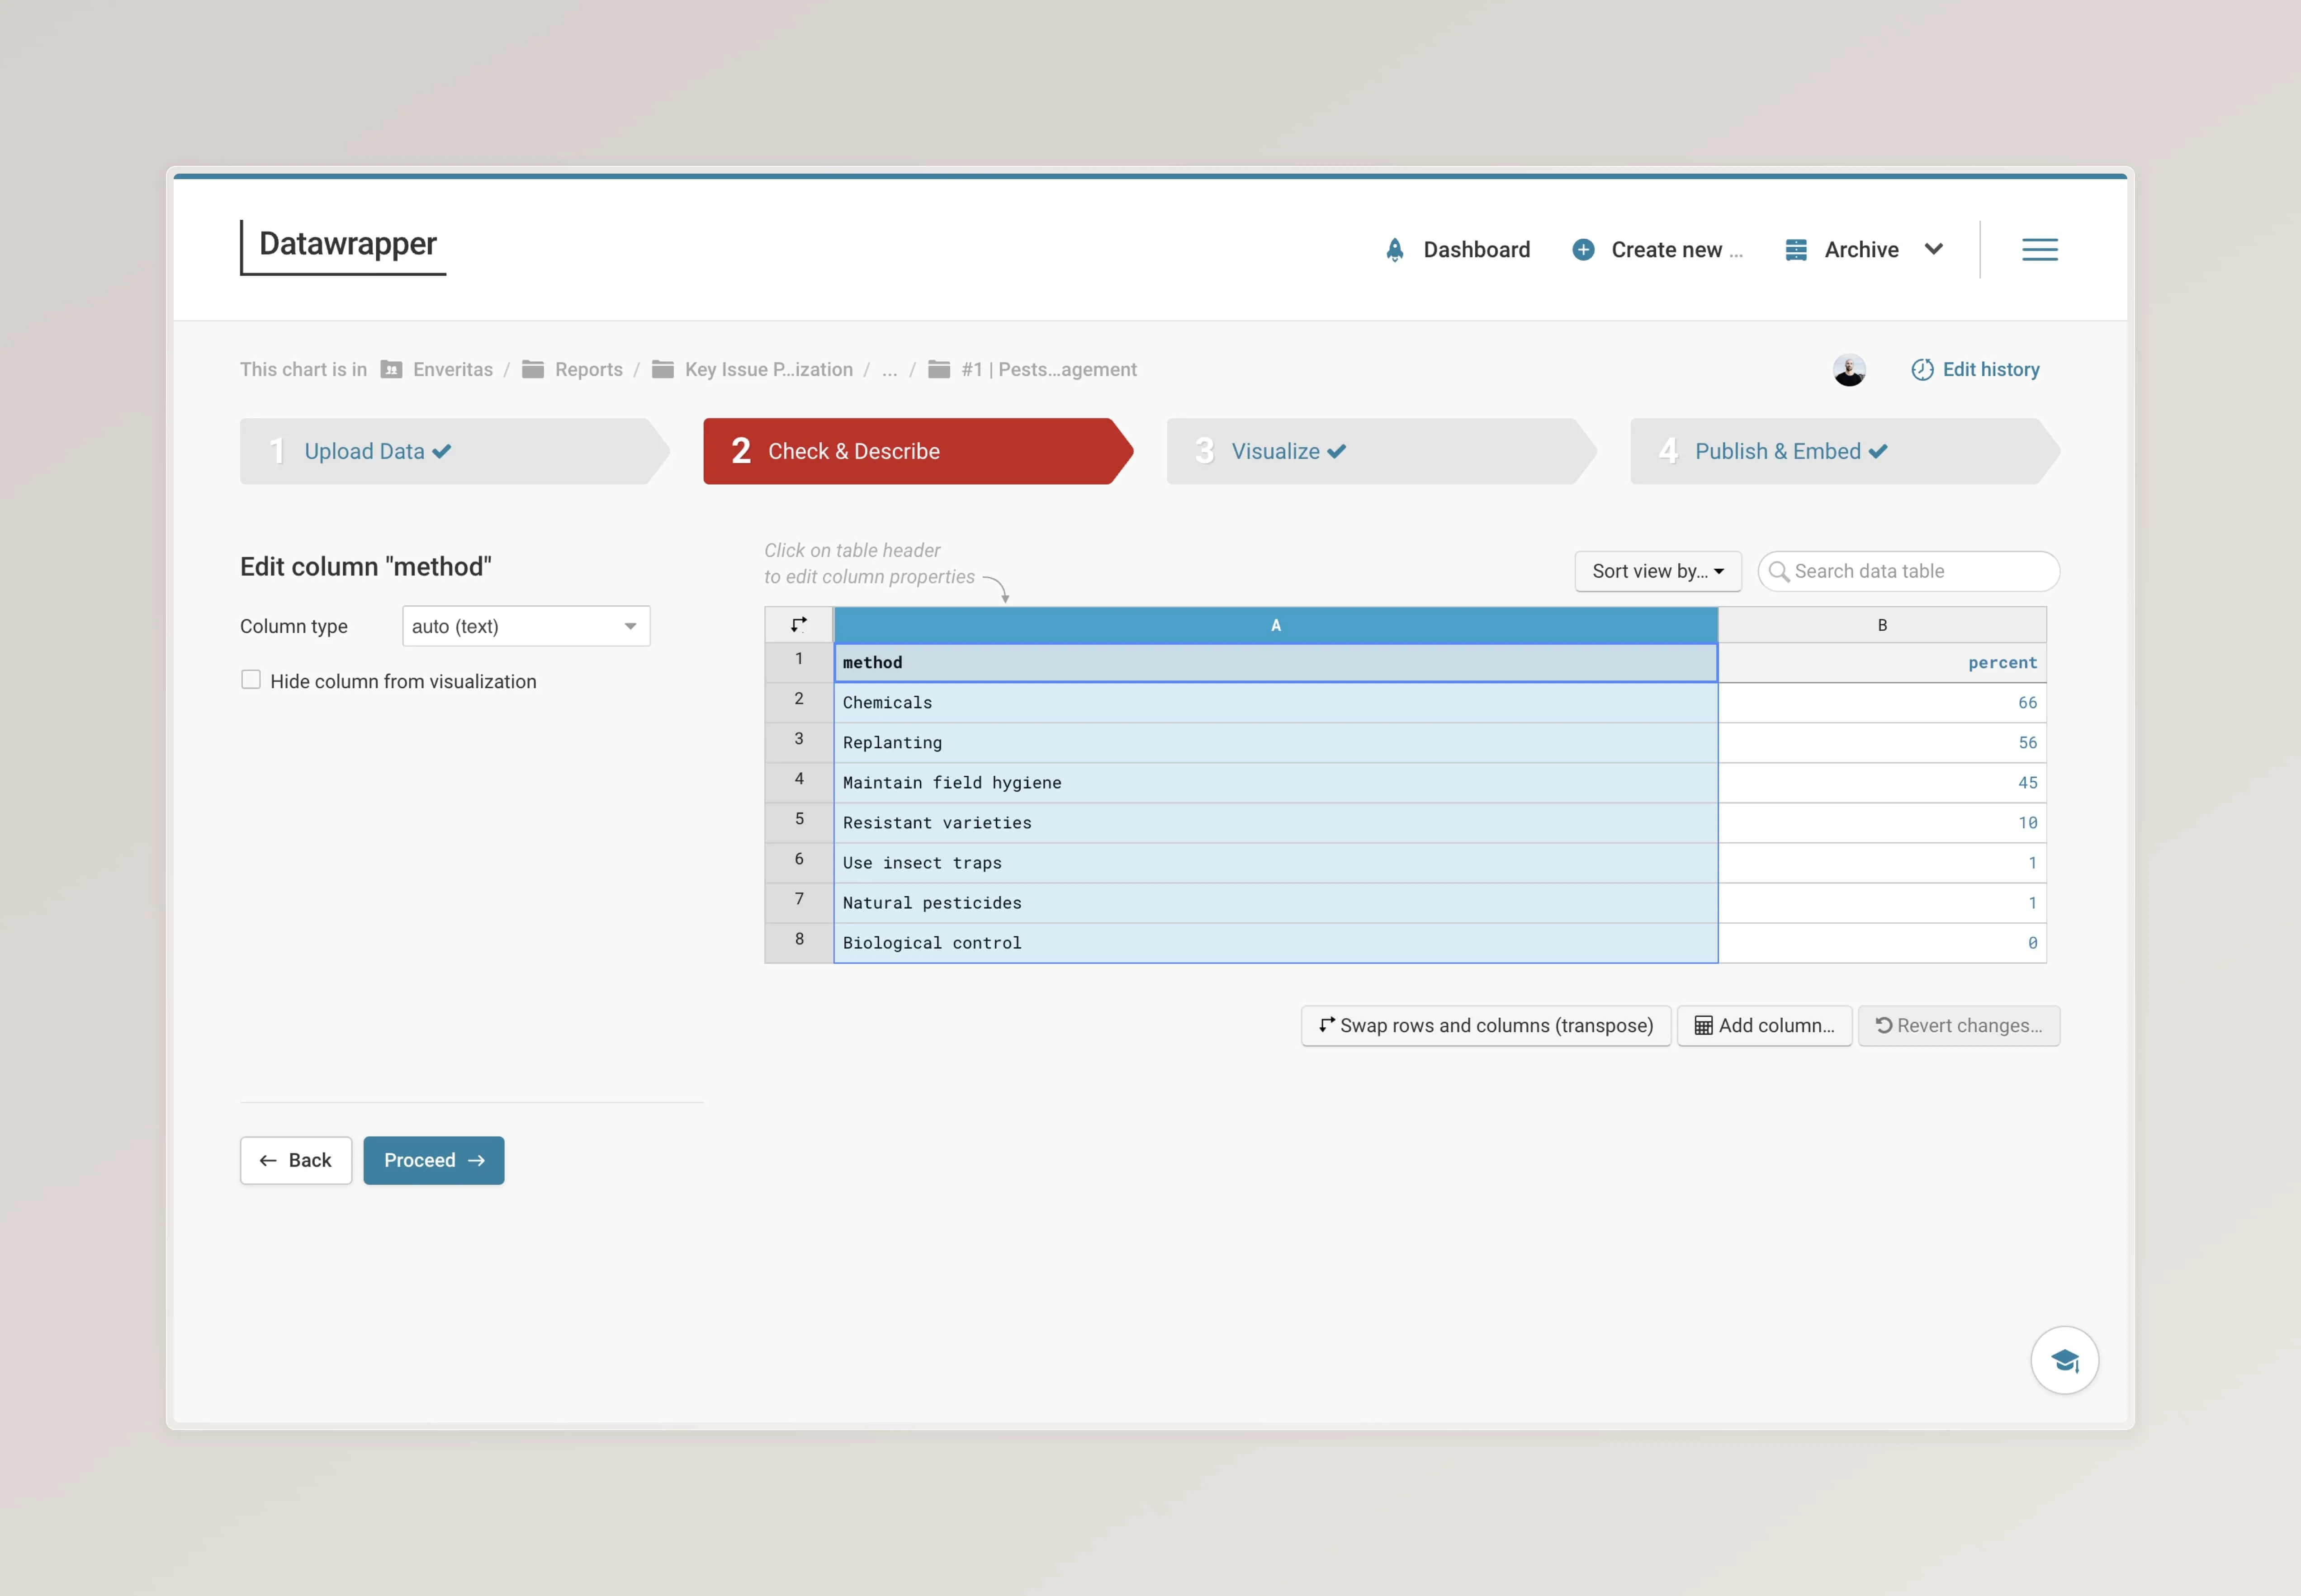
Check & Describe
In the second step the data quality can be checked. For example for type consistency or sorting. Individual columns can also be excluded from the chart while keeping them in the dataset. This is helpful when variants of a chart are required that focus on different subsets of a dataset.
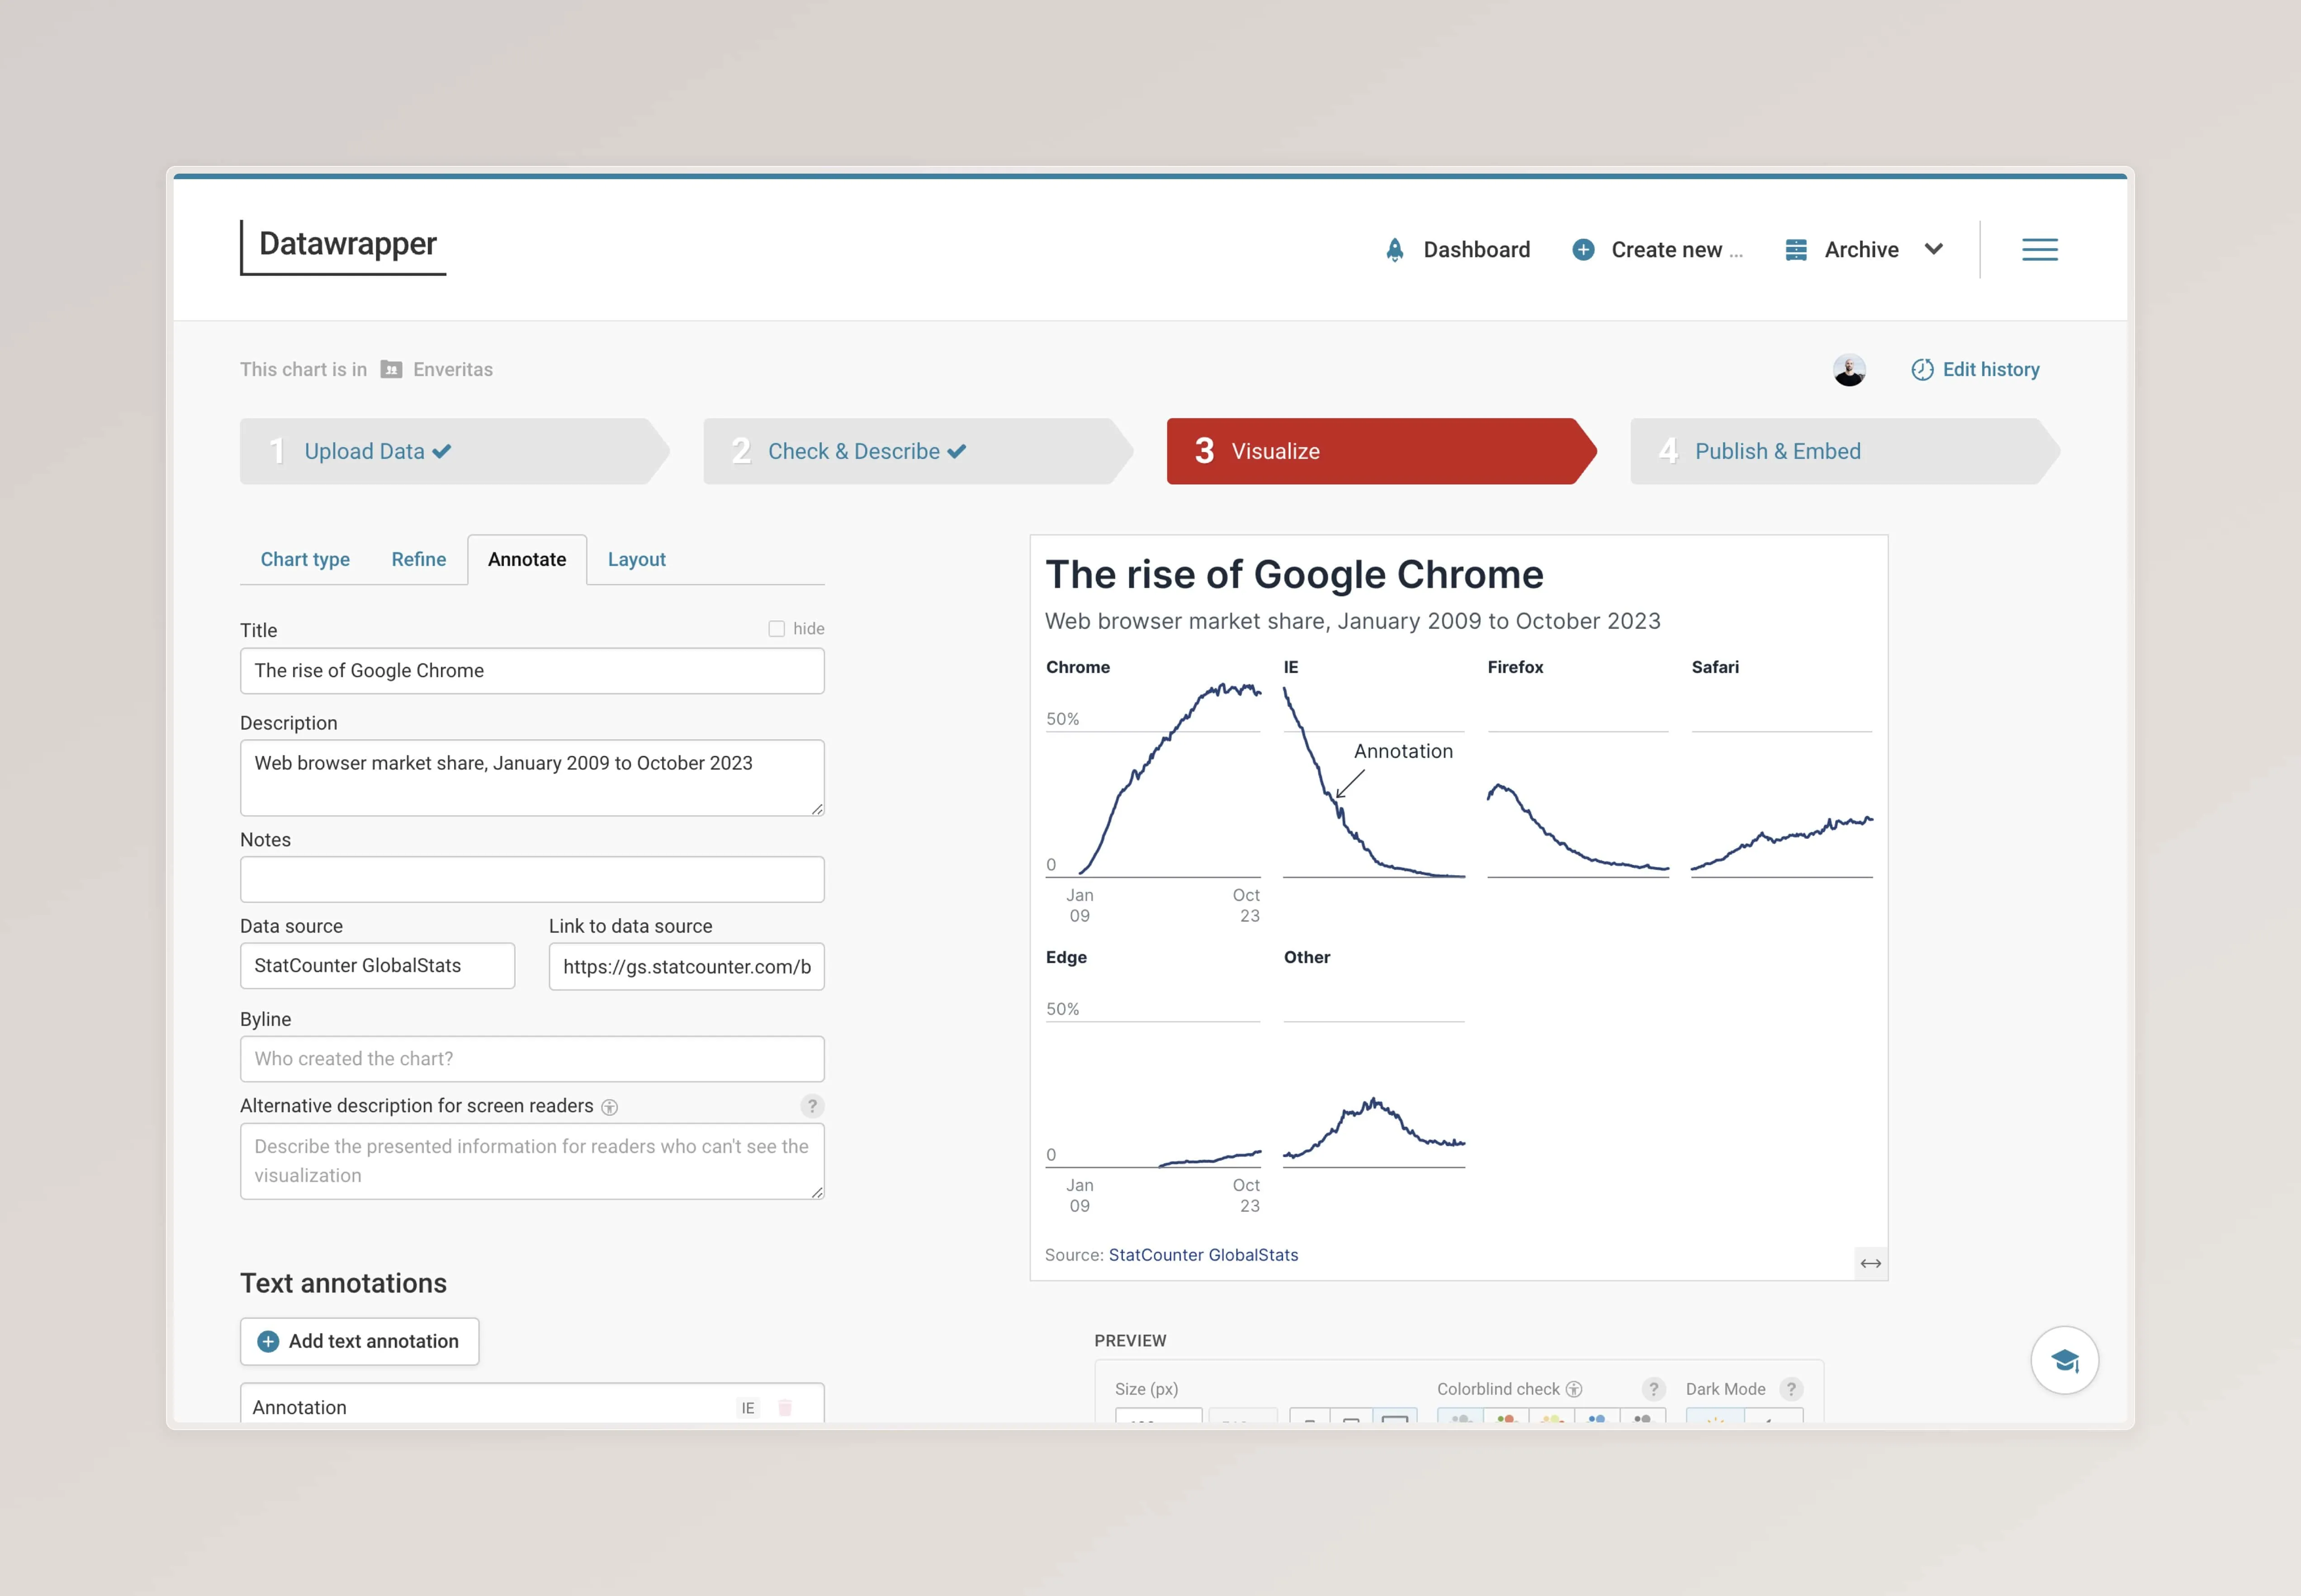
Visualize
After preparing the dataset the type of visualization is defined and customised. This step requires to work through the following four steps:
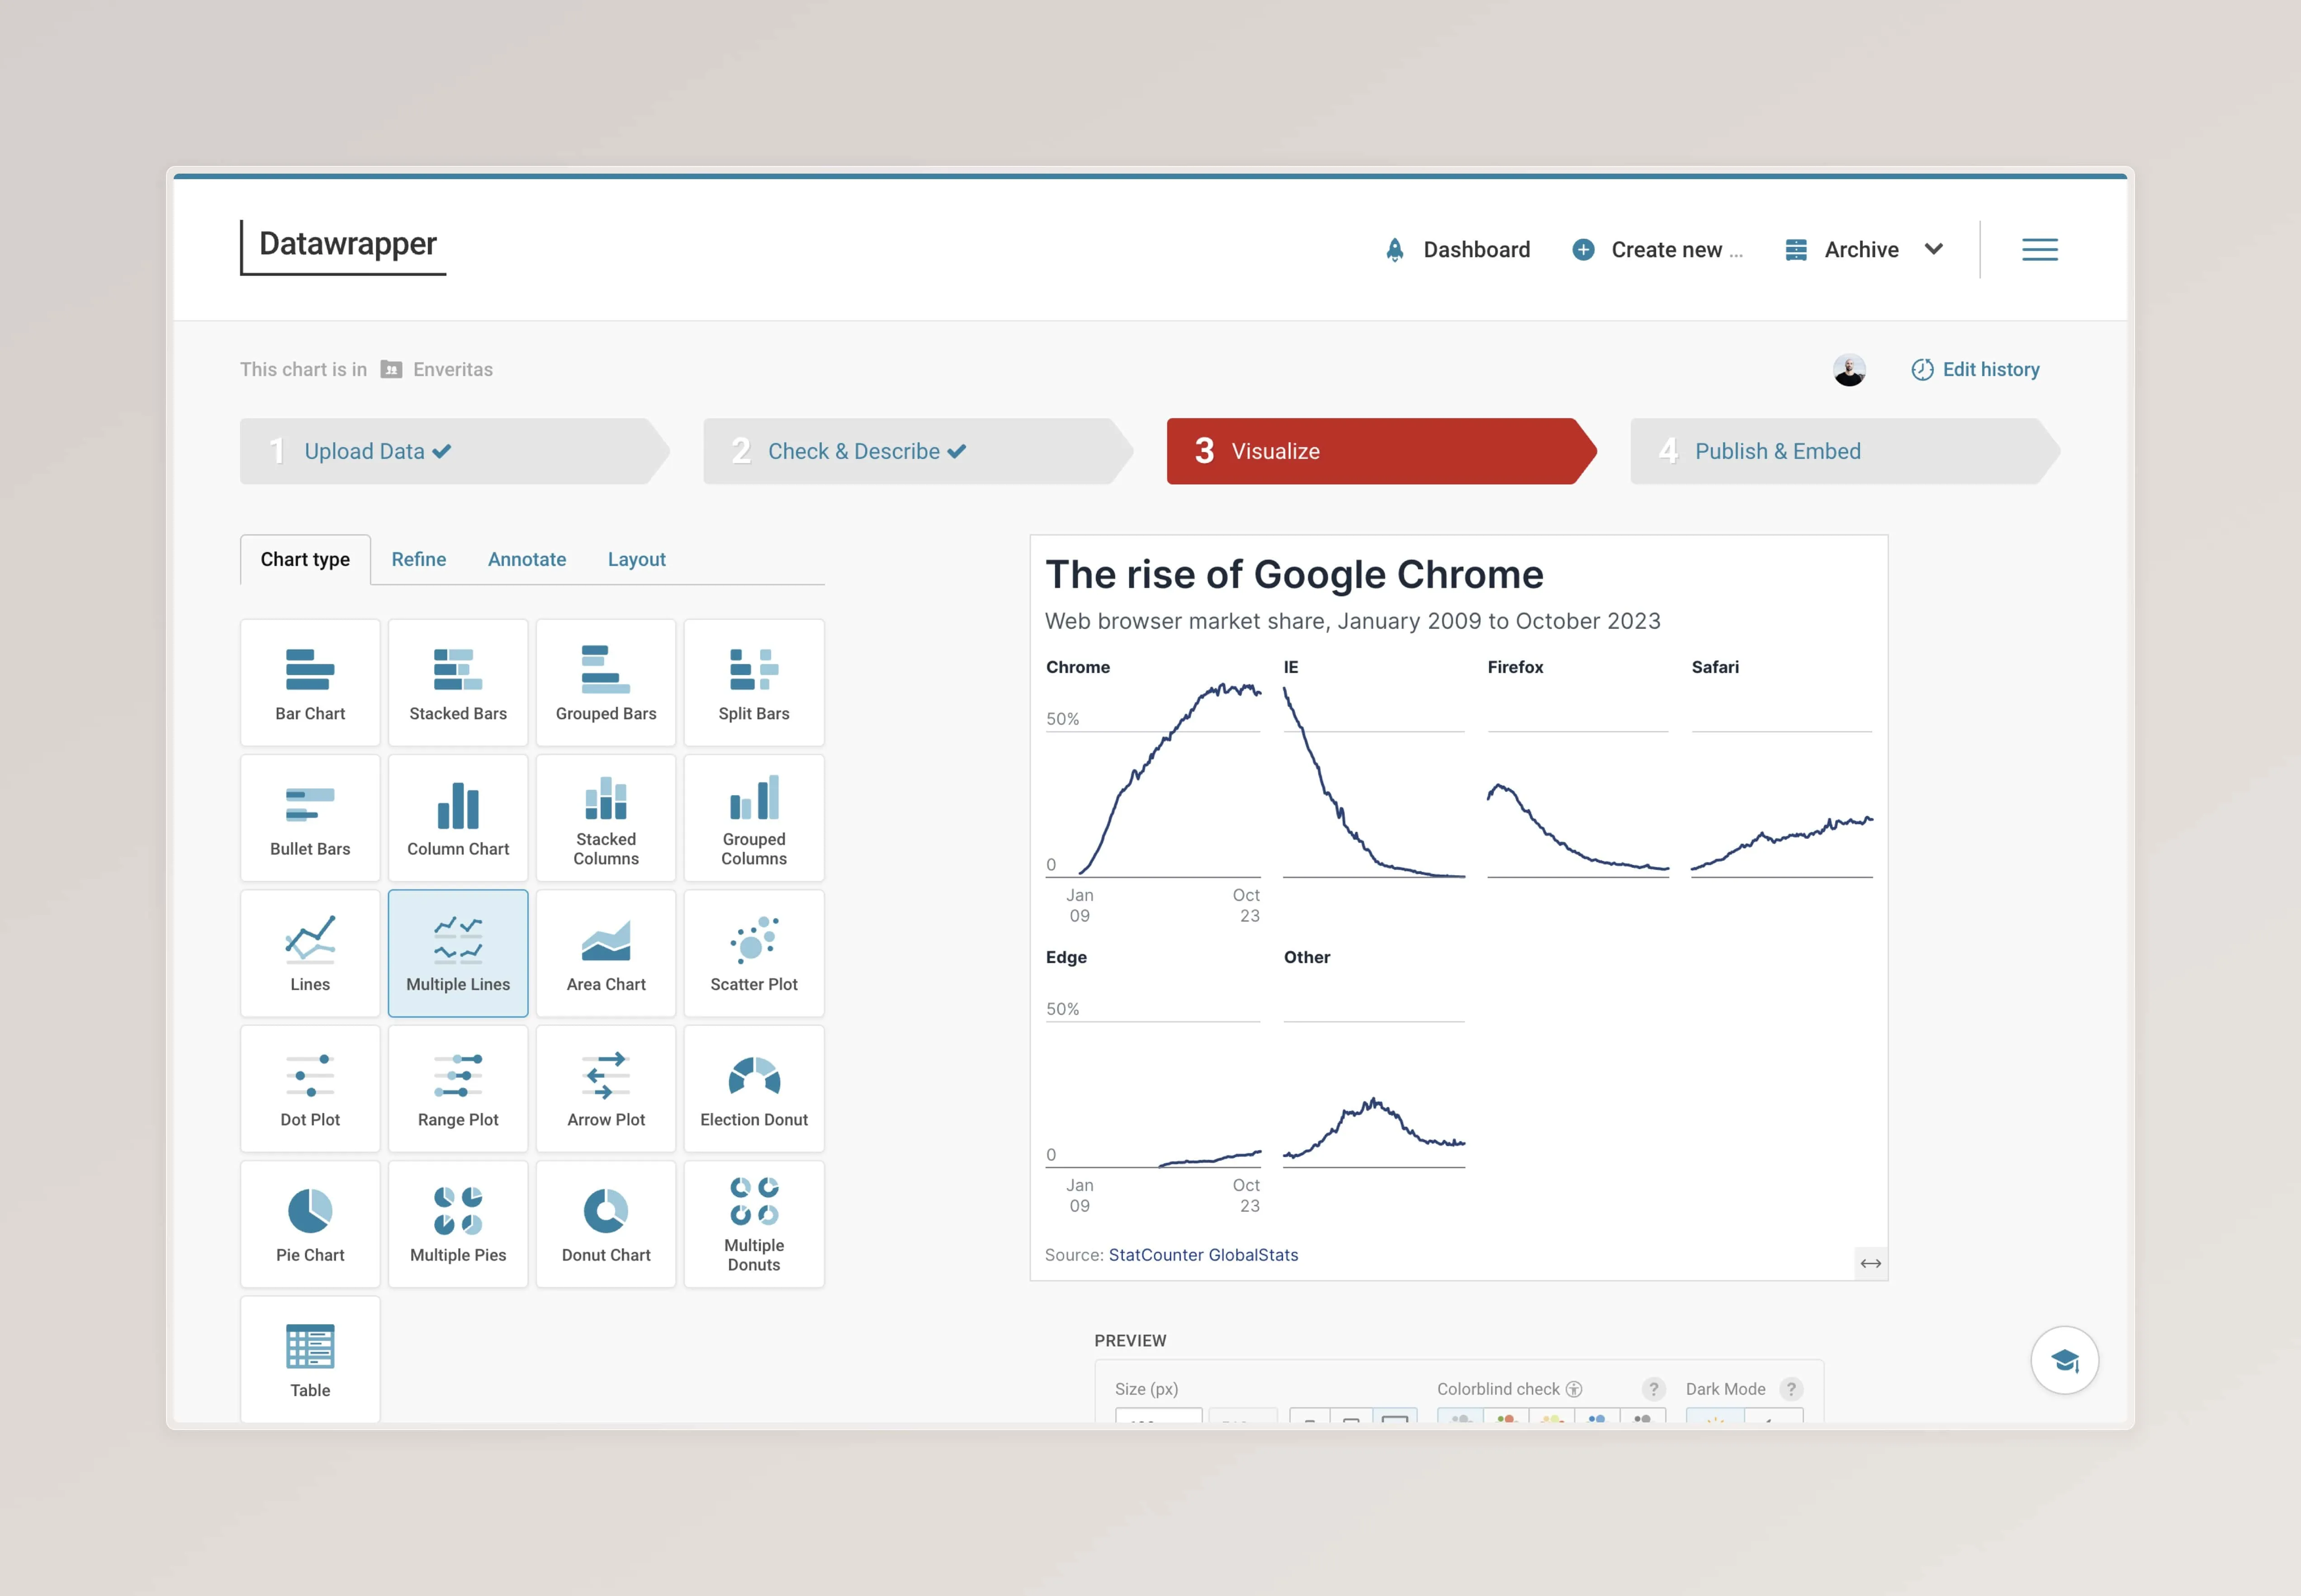
Chart type
Select a chart type that’s suitable to communicate your findings. Find the list of chart types below
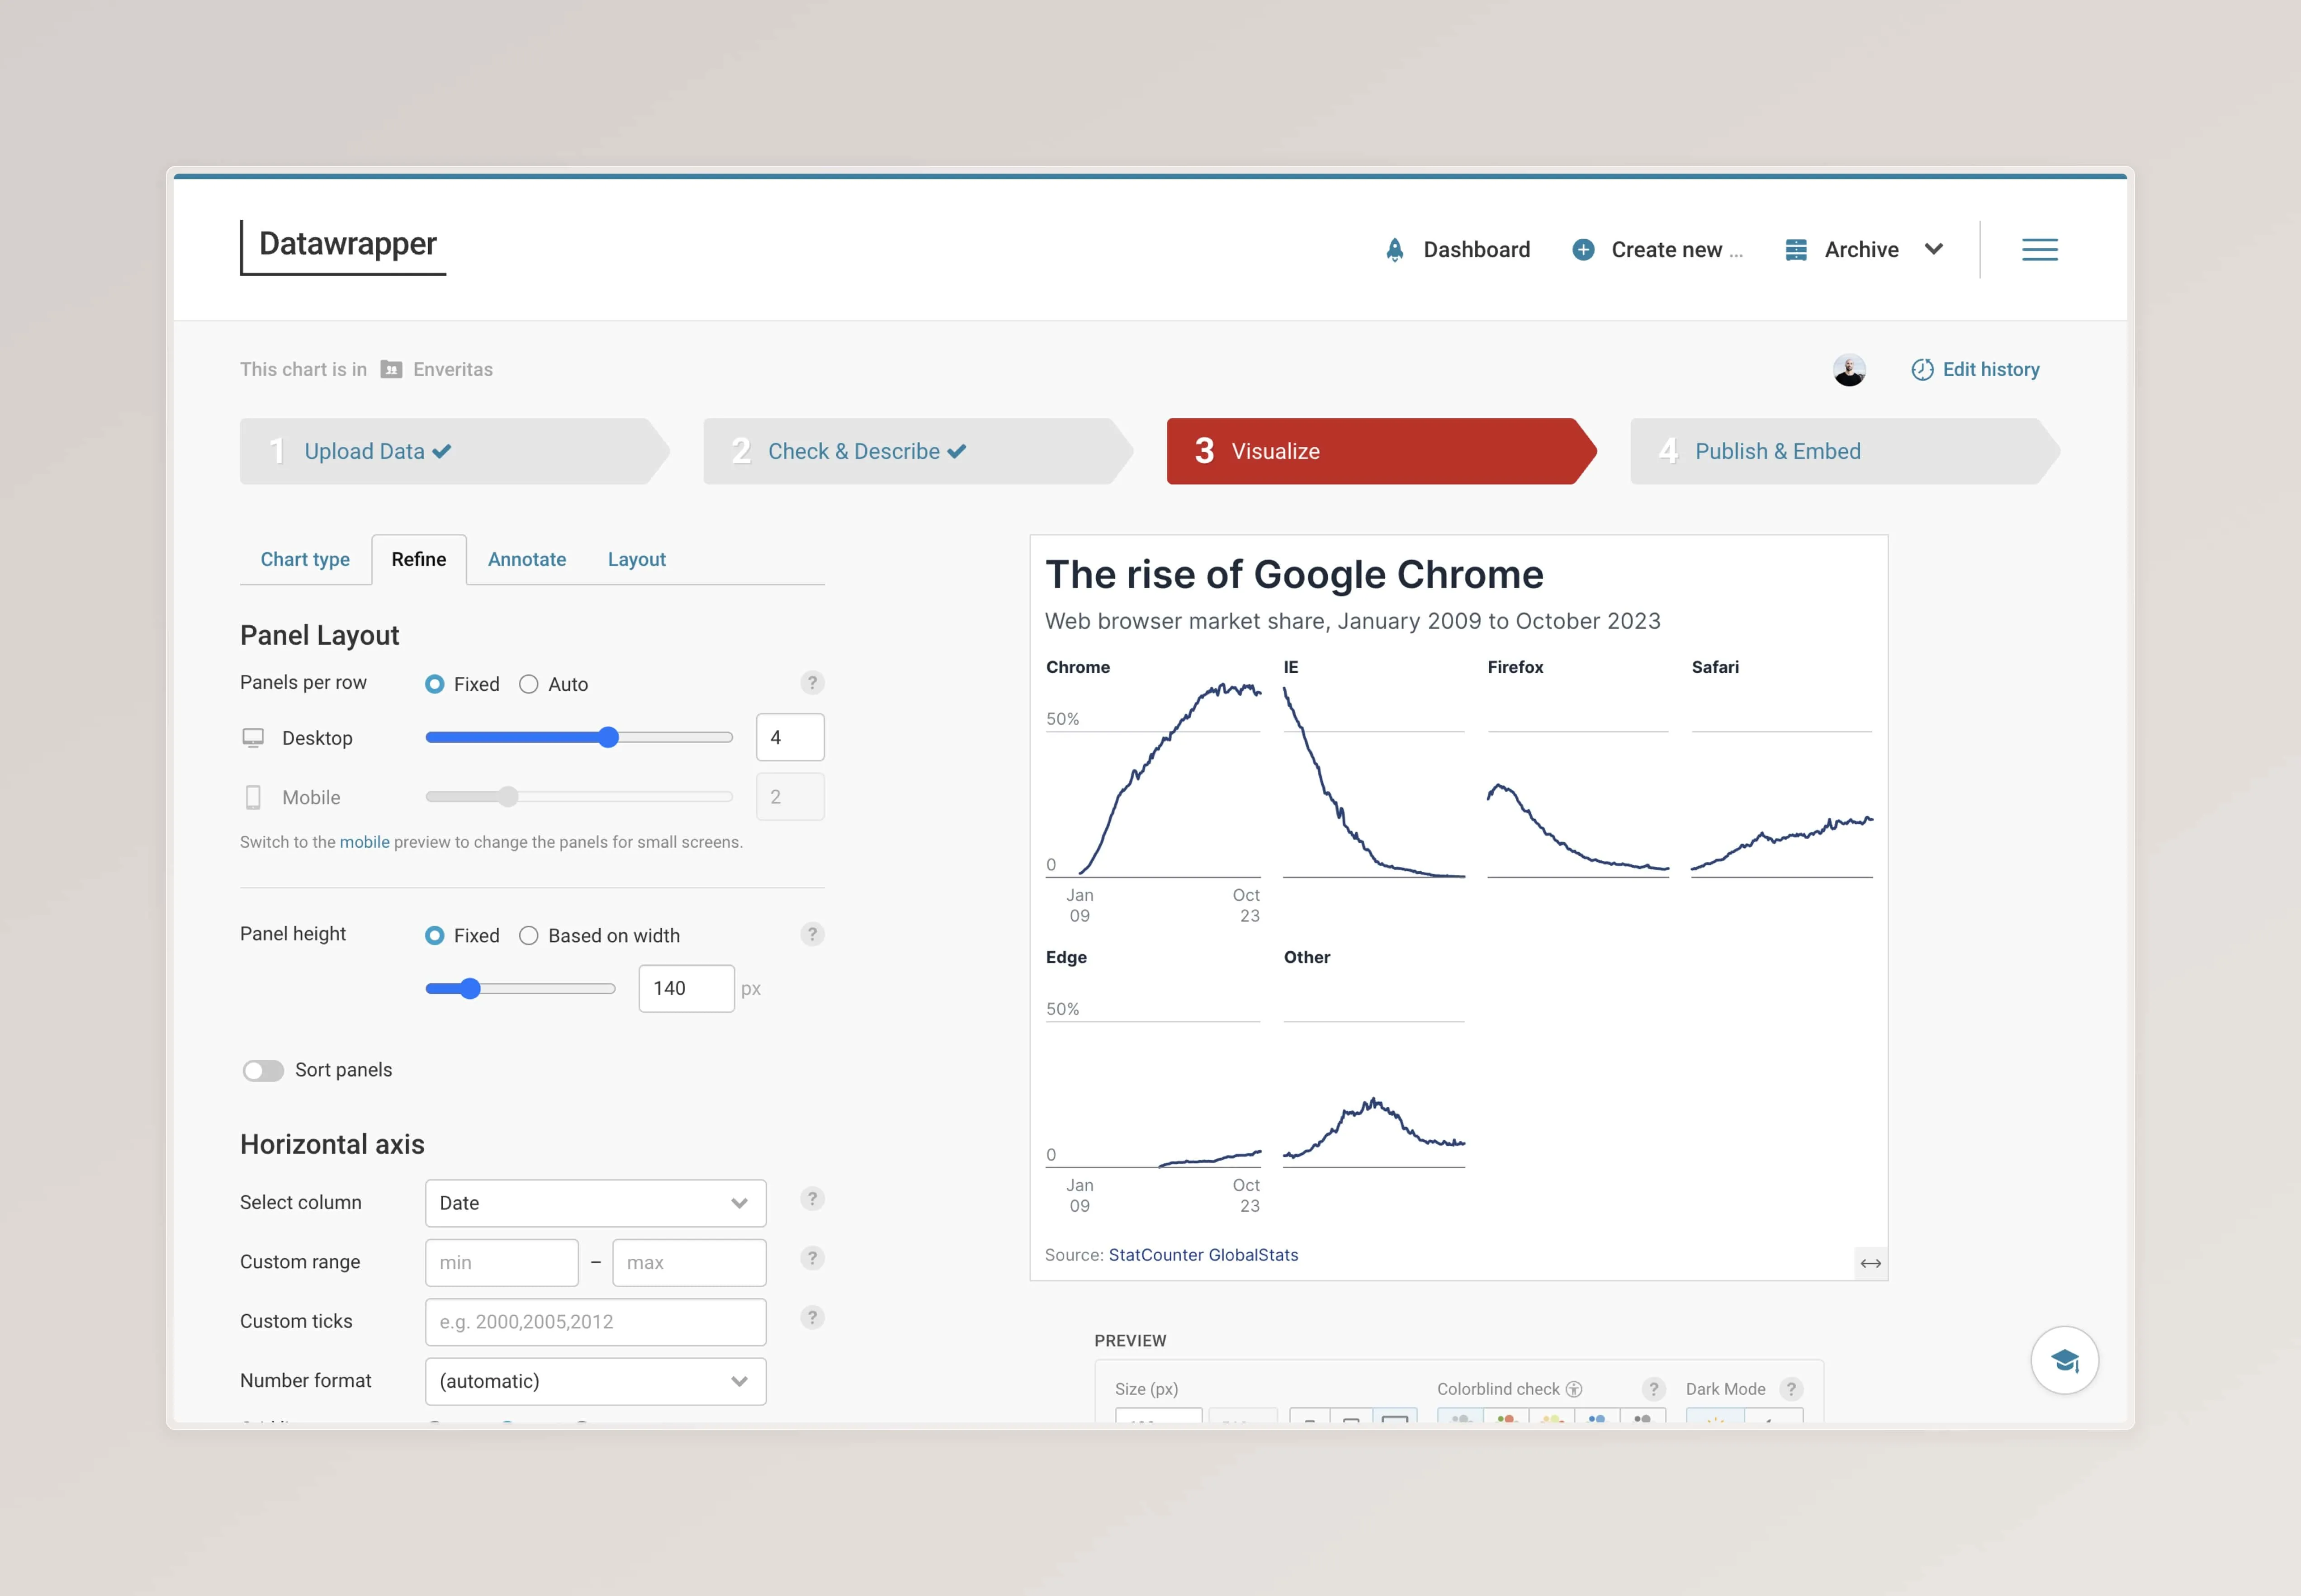
Refine
Here the layout can be further customised. This includes customising axis, color scales and chart specific settings.
As a rule of thumb we’re aiming to have a maximum data / ink ratio. So we’re avoiding unnecessary or redundant information or decoration that distracts the viewer of from the message we want to convey.
Axis
Axis labels are set inside the chart.
Annotate
The Annotation language used is simple and plain. Avoid using jargon terms that need further explanations. Instead focus on clear, concise and short sentences.
Each chart has to include a headline, subline and a data source. The headline shares the main take away the viewer should have from looking at the chart. The description gives a brief summary of the context of data that’s shown. What is the timeframe? What’s the type of data?
Text annotations inside the chart are a powerful to to guide the readers eye to important data points and help to filter out the signal from the noise. However annotation should be used intentionally to emphasize the message or bring important context.
Layout
In the layout tab the user can customise the interactive version of the chart. If static assets are generated this tab can be ignored.
In case a chart is published to be used in an artice on the public website features like data and image download options can be customised.

Publish & Embed
Export
| Columns | Scale factor | Border | Format | Background | Width | Include |
|---|---|---|---|---|---|---|
| 1 | 4 | 0px | PNG | Transparent | 400px | Full header and footer |
| 2 | 4 | 0px | PNG | Transparent | 800px | Full header and footer |
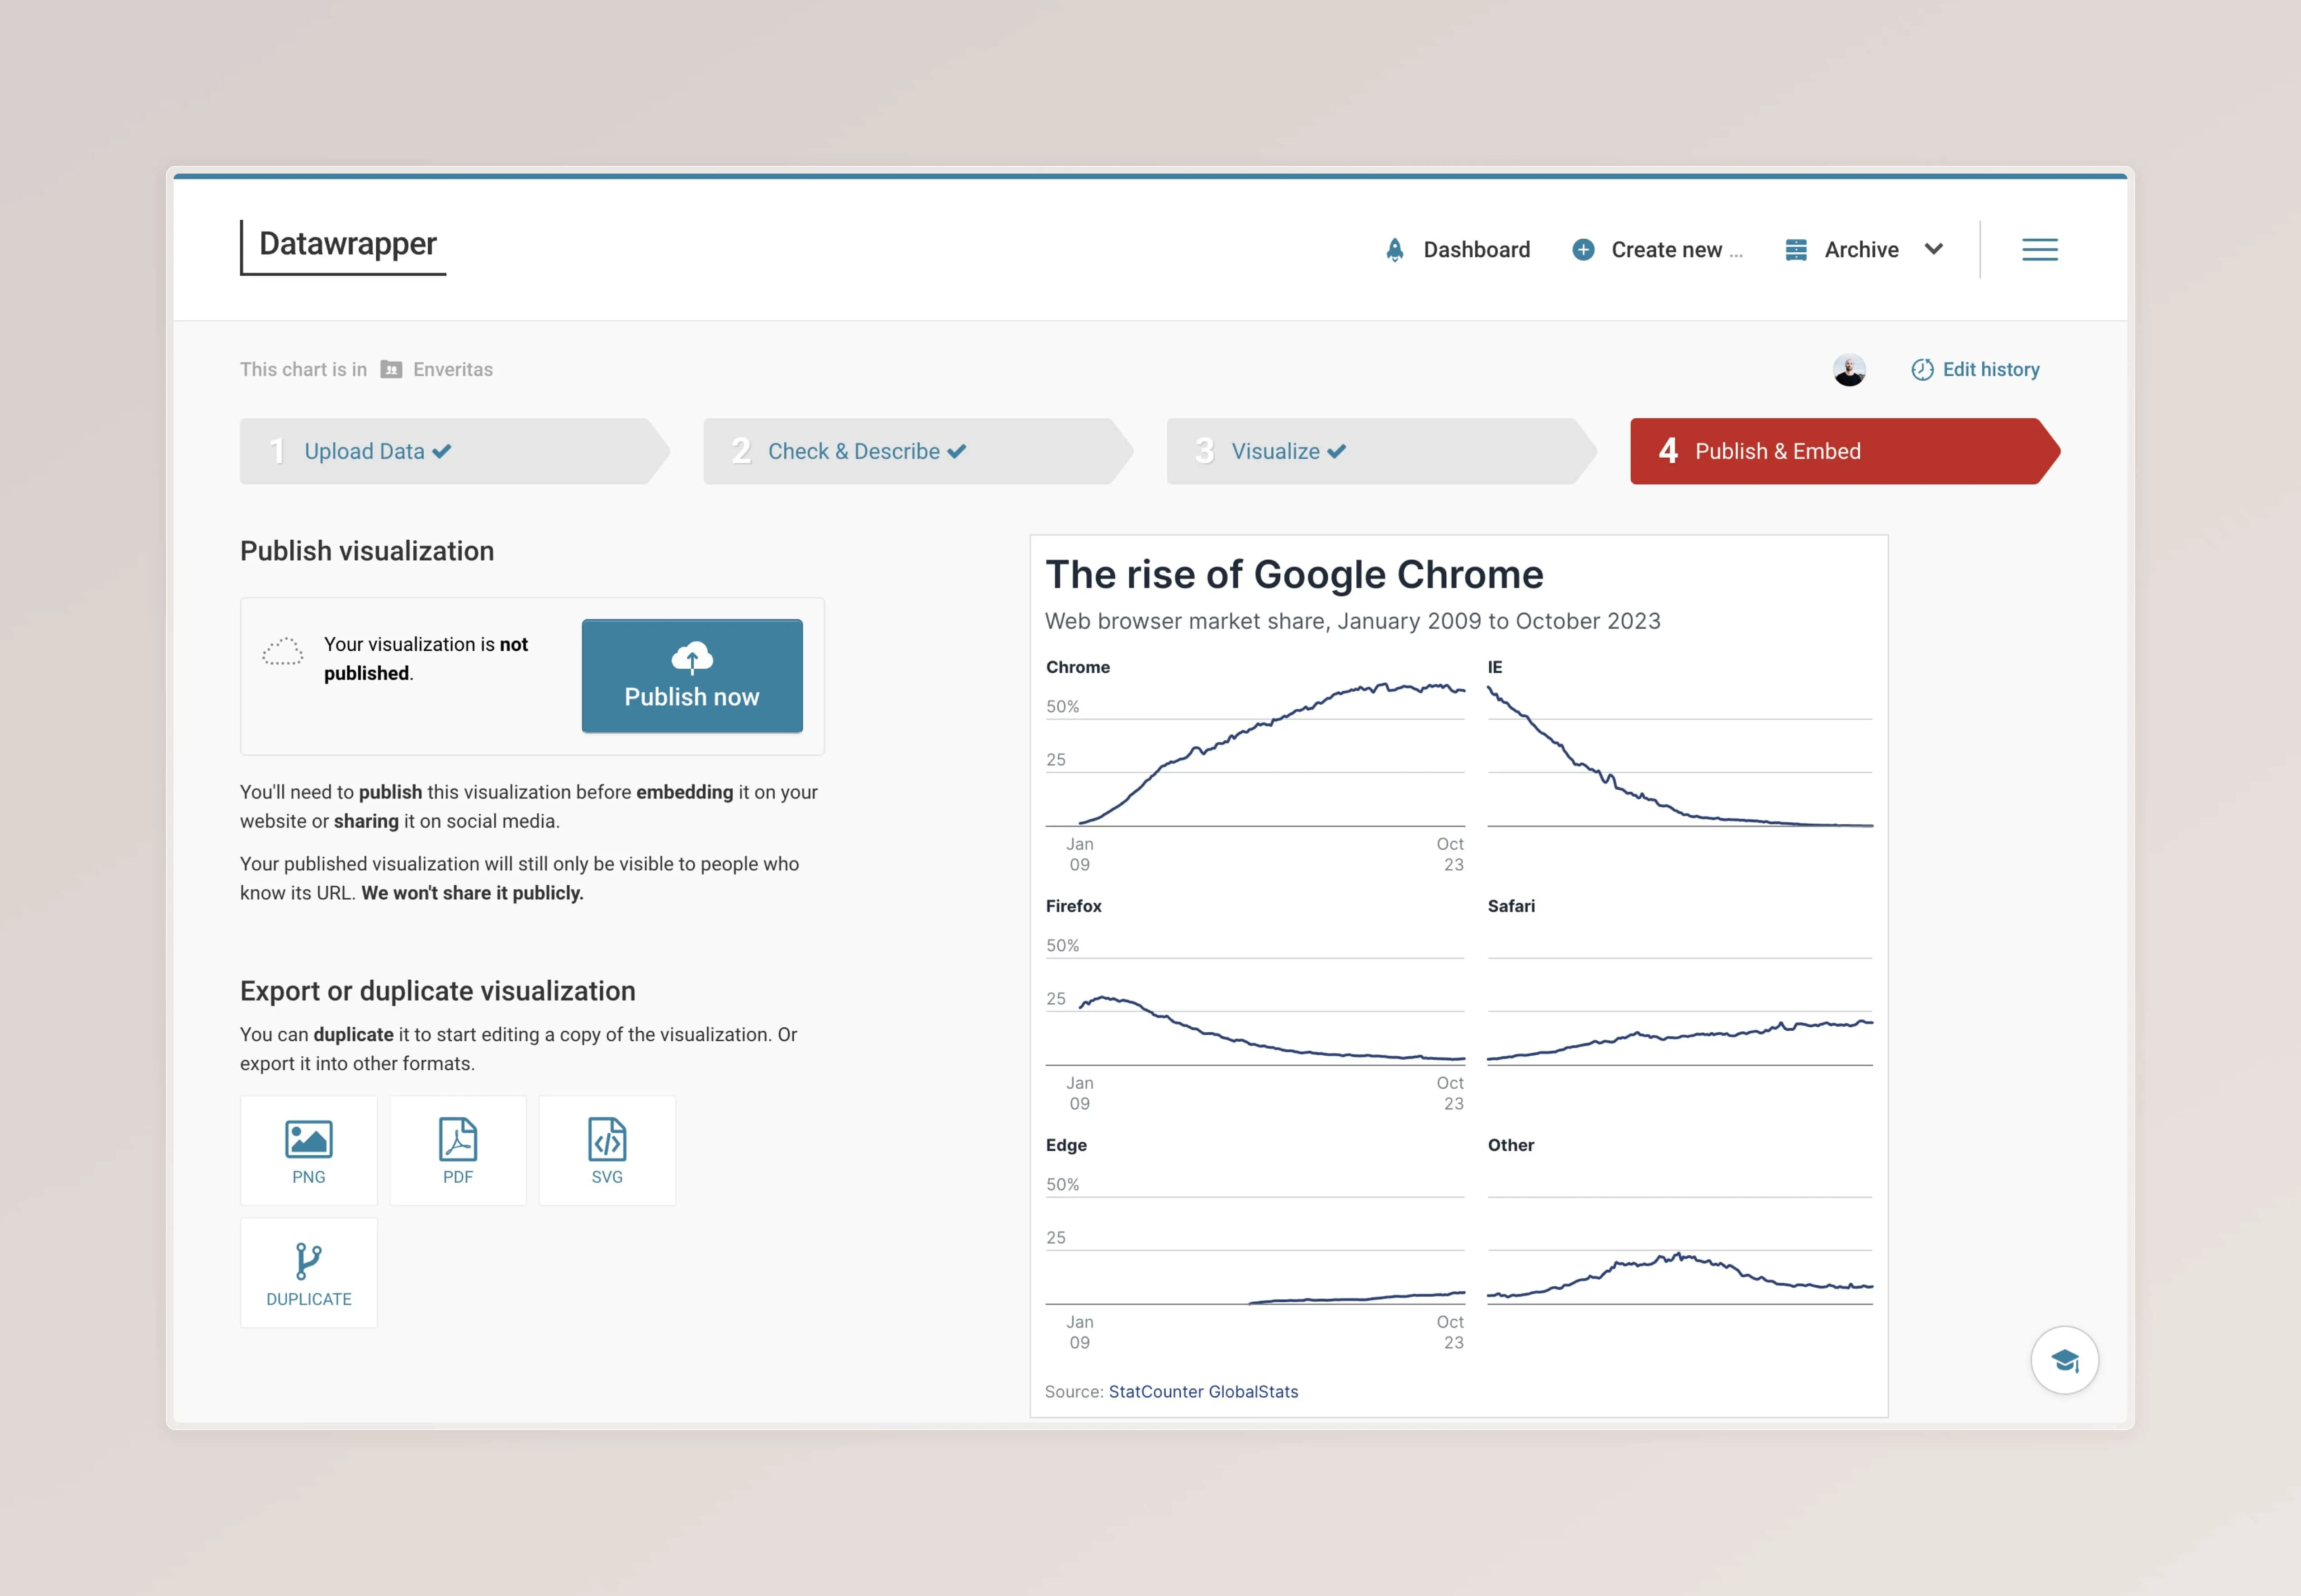
Chart types
In the Chart type tab you can choose how the dataset is visualised.
To get started, request a Datawrapper account at the #ask-dataviz slack channel slack channel. Once finished you can create your first chart by following the Datawrapper workflow.
Feedback and requests
Do you need more documentation or guidance? Do you have a feature or workflow request? Feel free send a message to the #ask-dataviz Slack channel.